Newport Beach is nine separate markets that share a city name and a school district. The MLS divides it into nine areas, and the spread between them is larger than the spread between most cities.
I pulled every listing recorded across all nine Newport Beach MLS areas over the last two years. That is 2,431 listings, 1,974 of them closed sales.
Citywide, closed sales ran $525,000 to $48,500,000 with a median of $3,794,000, at $1,542 per square foot, 2,398 square feet and a median lot of 6,287 square feet. Homes date from 1910 to 2027. The median sale took 26 days.
Split all 1,974 closed sales by price and the relationship is perfectly monotonic in all three columns:
There is no reversal anywhere in that ladder. Discount rises with price. Days on market rise with price. The share of sales closing below ask rises with price.
Citywide, 1,402 of 1,974 sales, 71 percent, closed below the asking price. Only 255 closed above. Another 317 closed at exactly list.
What that means in practice depends entirely on which side of the transaction you are on. A buyer above seven million should plan on a month or more of marketing time and a negotiation of three to six percent. A seller above twelve million should price for a 53 day median and expect to take something off. And a buyer under two million is in a genuinely competitive market where a 64 percent below-ask rate still means more than a third of sales met or beat the number.
Compare the neighbouring city. In Costa Mesa the median sale closes at exactly the asking price in 13 days, and 52 percent of sales meet or beat ask. Newport Beach is a slower, more negotiated market at every price point.
Every MLS area, using recorded closed sales, ordered by median price:
Three things fall out of that table that are worth saying plainly.
Newport Heights is the only area in the city under $1,000 per square foot, and it has the second largest lots. At $954 per foot on a 7,325 square foot median lot, it is less than half the per foot cost of Balboa Island at $2,291, where the median lot is 2,589 square feet. If land is what you value, the price of it in this city varies by more than the price of the houses.
The two cheapest areas per square foot are also the two fastest and the two closest to asking price. Eastbluff and Harbor View at $1,205 clears in 19.5 days at 1.97 percent under. Westcliff and Dover Shores at $1,329 clears in 19 days at 2.00 percent under. Meanwhile West Newport and Lido at $1,842 takes 44 days and discounts 3.92 percent.
The small lot waterfront areas carry the highest per foot rates. Balboa Island and the Lower Bay at $2,291 and the Balboa Peninsula at $2,210 sit on median lots of 2,589 and 2,625 square feet. That is the price of the water, expressed as a per foot figure on a very small parcel, and it is why a citywide price per square foot is not a useful number.
Three hundred and thirty nine of the 1,974 closed sales, 17 percent, closed below $2,000,000, and that band closed fastest of all at a median of 21 days.
The lowest recorded close in two years is $525,000. The lowest current asking price citywide is $499,888.
That inventory is concentrated in three places: the attached communities of Newport Coast such as Trovare and Summit, the older condominium tracts around Newport Heights and Westcliff, and the smaller units on the Balboa Peninsula. Newport Heights, at a $1,807,500 area median, is the only area whose typical sale sits in that band.
As of mid-September 2026: three hundred and thirty six active listings and eleven coming soon, forty in the under contract range and forty seven pending.
Actives run $499,888 to $69,998,000.
Against 1,974 sales in two years, 336 active listings is roughly four months of supply, which is meaningfully looser than Costa Mesa next door at about two months. Combined with 71 percent of sales closing below ask and 329 of 1,974 taking more than a hundred days, the recorded data describes a buyer's market in Newport Beach and a seller's market in Costa Mesa, at the same moment.
The highest recorded close in two years is $48,500,000 on Ocean Boulevard in Corona del Mar. Two hundred and thirty seven sales closed at zero days on market and 650 within ten days, so the fast, quiet transaction is still very much alive even in a slower market.
The area figures above still average many very different communities. These are the Newport Beach neighborhoods and communities measured individually, each with its own guide:
What do homes sell for in Newport Beach?
1,974 closed sales over the last two years ranged $525,000 to $48,500,000 with a citywide median of $3,794,000. By area the medians run from $1,807,500 in Newport Heights to $11,950,000 in Crystal Cove.
Which part of Newport Beach is most expensive?
Crystal Cove at a median of $11,950,000 and $2,702 per square foot. Balboa Island and the Lower Bay is next at $5,150,000, then Newport Coast at $5,062,500.
Which part is least expensive?
Newport Heights at a median of $1,807,500 and $954 per square foot, the only area in the city under $1,000 per foot. It also has the second largest median lot at 7,325 square feet.
Do homes sell above asking price in Newport Beach?
Rarely. Of 1,974 closed sales, 1,402 closed below list, 317 at list and only 255 above. That is 71 percent closing under the asking price.
How much below asking should I expect to negotiate?
It depends on the price. Under $2,000,000 the median is 1.82 percent under. Between $4,000,000 and $7,000,000 it is 3.06 percent. Above $12,000,000 it is 5.71 percent.
How long do homes take to sell in Newport Beach?
Median 26 days citywide, but it scales with price: 21 days under $2,000,000, 28.5 days between $4,000,000 and $7,000,000, and 53 days above $12,000,000. Two hundred and thirty seven sales closed at zero days on market and 329 took more than a hundred.
Which Newport Beach area sells fastest?
Westcliff and Dover Shores at 19 days, then Eastbluff and Harbor View at 19.5. Those are also the two areas closest to asking price.
Which sells slowest?
West Newport and Lido at 44 days, then the Balboa Peninsula at 41.
What is the price per square foot in Newport Beach?
Citywide median $1,542, but by area it runs $954 in Newport Heights, $1,205 in Eastbluff and Harbor View, $1,329 in Westcliff and Dover Shores, $1,468 in Newport Coast, $1,842 in West Newport and Lido, $1,937 in Corona del Mar, $2,210 on the Balboa Peninsula, $2,291 on Balboa Island and $2,702 in Crystal Cove.
How big are Newport Beach lots?
Citywide median 6,287 square feet, but the range between areas is enormous: 2,589 on Balboa Island and the Lower Bay, 2,625 on the Balboa Peninsula, 7,325 in Newport Heights, 8,800 in Westcliff and Dover Shores, and 14,842 in Crystal Cove.
Can you buy a home in Newport Beach under $2,000,000?
Yes. Three hundred and thirty nine of 1,974 recent closed sales, 17 percent, closed below that figure, and the lowest current asking price citywide is $499,888. That inventory is mostly attached homes in Newport Coast, Newport Heights, Westcliff and the Balboa Peninsula.
How old are Newport Beach homes?
Recorded sales span 1910 to 2027.
How much inventory is there right now?As of mid-September 2026, three hundred and thirty six active listings from $499,888 to $69,998,000, eleven more coming soon, plus forty under contract and forty seven pending. Against 1,974 sales in two years that is still roughly four months of supply.
Is Newport Beach a buyer's or a seller's market?
By the recorded numbers it is a buyer's market. Seventy one percent of sales close below ask, the median is 2.76 percent under, and there is about four months of standing inventory. Costa Mesa next door is the opposite: the median sale closes at exactly ask in 13 days with about two months of supply.
What are the nine Newport Beach MLS areas?
N6 Newport Heights, N7 West Bay and Santa Ana Heights covering Westcliff and Dover Shores, N8 West Newport and Lido, N9 Lower Newport Bay and Balboa Island, NP Balboa Peninsula, NV East Bluff and Harbor View, N26 Newport Coast, CR Crystal Cove and CS Corona del Mar and Spyglass.
What is the most expensive sale recorded recently?
$48,500,000 on Ocean Boulevard in Corona del Mar, an 11,628 square foot 2026 build.
How do Newport Beach HOA dues compare across the city?
Very widely, and the billing frequency differs by community, which makes portal comparisons unreliable. Measured monthly equivalents range from about $35 in Harbor View Original and $70 in Newport Shores to $835 at One Ford Road, $898 to $925 in Big Canyon Villas and $892 to $1,255 in the Crystal Cove villages. Lido Isle quotes annually and Bayshores quotes quarterly, both of which look far more expensive than they are.
Which school district serves Newport Beach?
Newport Mesa Unified School District. Attendance boundaries are set by the district and do change, so confirm your specific address with the district rather than relying on any listing or portal.
Where does the data on this page come from?
The California Regional MLS, covering every listing recorded across all nine Newport Beach MLS areas over the last two years, using recorded closed sales rather than list prices or automated estimates, with area assignment, dues, dues frequency and list versus close prices read from the structured fields on individual listings. Figures are current as of the last update to this page and should be verified for any specific property.
84,304 people live in Newport Beach, where the median age is 46 and the average individual income is $113,918. Data provided by the U.S. Census Bureau.
Total Population
Median Age
Population Density Population Density This is the number of people per square mile in a neighborhood.
Average individual Income
Newport Beach has 38,103 households, with an average household size of 2.2. Data provided by the U.S. Census Bureau. Here’s what the people living in Newport Beach do for work — and how long it takes them to get there. Data provided by the U.S. Census Bureau. 84,304 people call Newport Beach home. The population density is 3,543 and the largest age group is Data provided by the U.S. Census Bureau.
Total Population
Population Density Population Density This is the number of people per square mile in a neighborhood.
Median Age
Men vs Women
Population by Age Group
0-9 Years
10-17 Years
18-24 Years
25-64 Years
65-74 Years
75+ Years
Education Level
Total Households
Average Household Size
Average individual Income
Households with Children
With Children:
Without Children:
Marital Status
Blue vs White Collar Workers
Blue Collar:
White Collar:
There's plenty to do around Newport Beach, including shopping, dining, nightlife, parks, and more. Data provided by Walk Score and Yelp.
Explore popular things to do in the area, including Christine Overstreet the Wine Merchant, 4 Sails, and Castaway's Casuals.
| Name | Category | Distance | Reviews |
Ratings by
Yelp
|
|---|---|---|---|---|
| Dining | 1.07 miles | 0 reviews | 0/5 stars | |
| Shopping | 0.39 miles | 0 reviews | 0/5 stars | |
| Shopping | 0.49 miles | 0 reviews | 0/5 stars | |
| Shopping | 0.77 miles | 2 reviews | 5/5 stars | |
| Shopping | 0.79 miles | 0 reviews | 0/5 stars | |
| Shopping | 1.19 miles | 0 reviews | 0/5 stars | |
| Active | 1.18 miles | 0 reviews | 0/5 stars | |
| Active | 1.23 miles | 0 reviews | 0/5 stars | |
| Active | 1.23 miles | 0 reviews | 0/5 stars | |
| Nightlife | 1.07 miles | 0 reviews | 0/5 stars | |
| Beauty | 0.58 miles | 0 reviews | 0/5 stars | |
| Beauty | 0.67 miles | 0 reviews | 0/5 stars | |
| Beauty | 0.72 miles | 2 reviews | 3/5 stars | |
| Beauty | 0.72 miles | 0 reviews | 0/5 stars | |
| Beauty | 1.15 miles | 0 reviews | 0/5 stars | |
| Beauty | 1.19 miles | 1 review | 5/5 stars | |
| Beauty | 1.21 miles | 11 reviews | 4.6/5 stars | |
| Beauty | 1.21 miles | 0 reviews | 0/5 stars | |
| Beauty | 1.23 miles | 0 reviews | 0/5 stars | |
| Beauty | 1.24 miles | 3 reviews | 5/5 stars | |
| Beauty | 1.24 miles | 0 reviews | 0/5 stars | |
| Beauty | 1.25 miles | 0 reviews | 0/5 stars | |
| Beauty | 1.25 miles | 2 reviews | 5/5 stars | |
|
|
||||
|
|
||||
|
|
||||
|
|
||||
|
|
||||
|
|
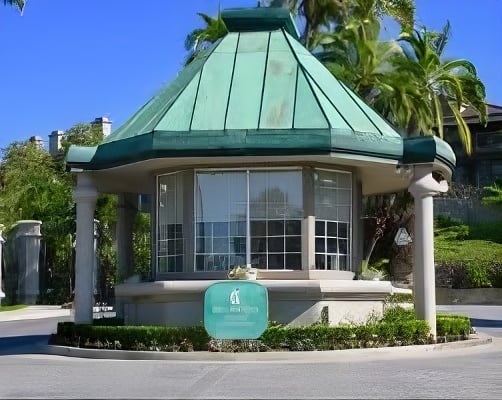
A gated community of condominium townhomes on Sea Island Drive in Newport Beach, built in 1977 and overlooking the Big Canyon Country Club golf course. Two to four bedroom plans...
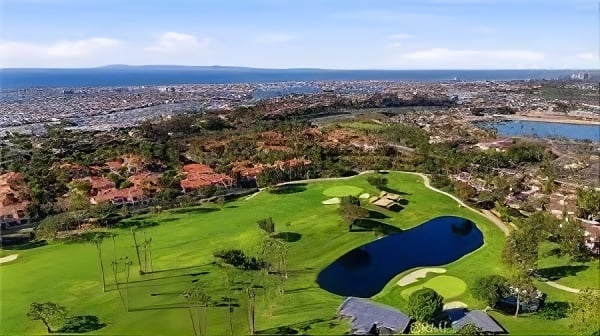
A gated condominium community of 228 residences on Villa Point Drive in Newport Beach, divided into separately gated East and West sections, with homes overlooking Newport Beach...
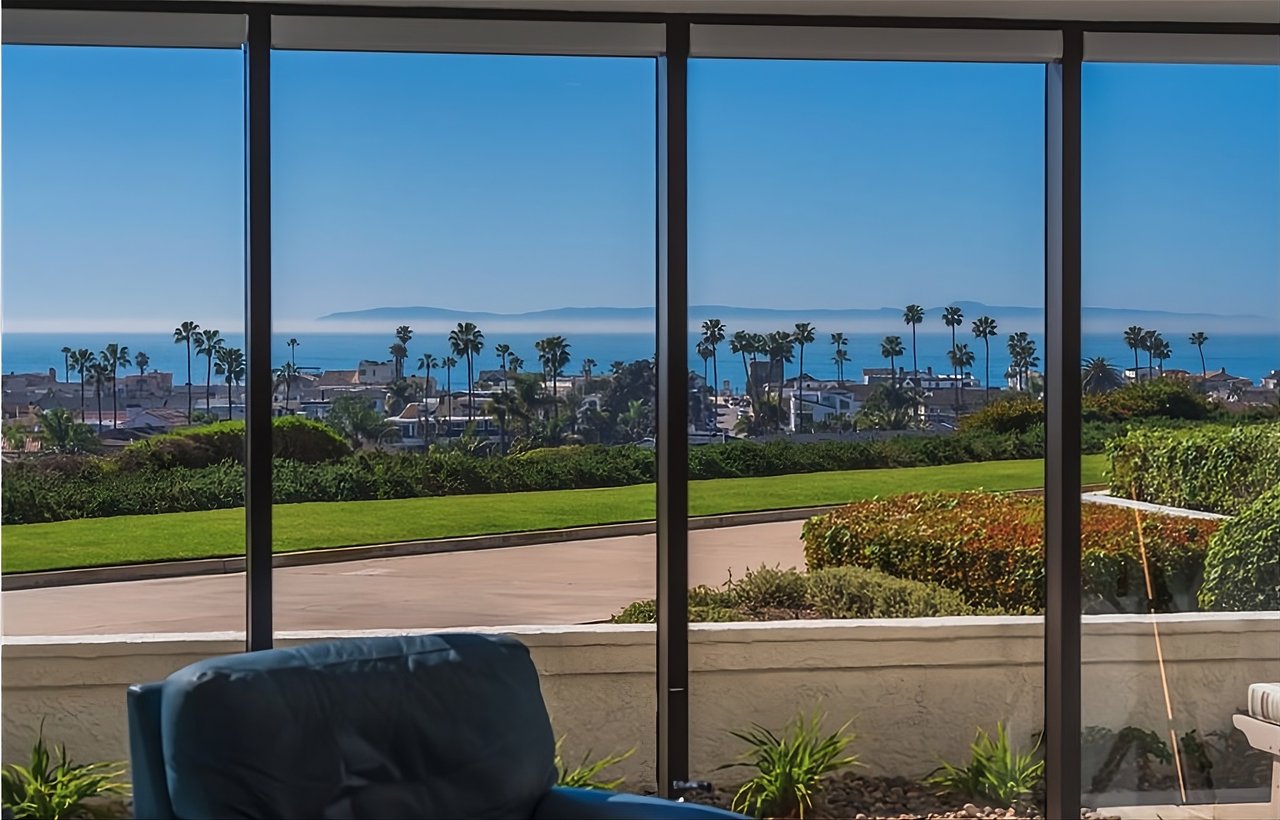
A gated bluff community of 449 condominium residences in Newport Beach, built in phases between 1979 and 1990 across Nice, Cagney, Paris and Lille Lanes. One to three bedroom pl...